
Many companies still use Microsoft Excel or Google Docs in some parts of their company reporting. Some companies still use these tools exclusively. With tools such as Tableau and Power BI available, how do you determine when it makes sense to migrate away from Excel? How do you know if it is worth the effort to switch to something else? Here are some questions to guide your decision.
5 Questions to Guide Your Decision
1. How much effort is involved in creating the current reports?
When a report is built using Excel, there is always some level of manual effort for the person assembling the report. For example, a company CFO may extract information from their accounting software and do multiple manipulations before sending it out to users. There are often multiple steps involved such as the following:
- Extracting data from source
- Data cleaning
- Adding formulas
- Adding filters
- Creating pivot tables and charts
- Testing and verifying numbers
- Sending to users and educating users on report
To calculate the cost of producing a report, you can use this formula:
Amount of time spent x salary or hourly rate x how many times these steps are repeated = cost of producing a report
Don’t forget about the opportunity cost. What else could this employee be doing instead of assembling the report? Could this person be doing more value-added tasks instead?
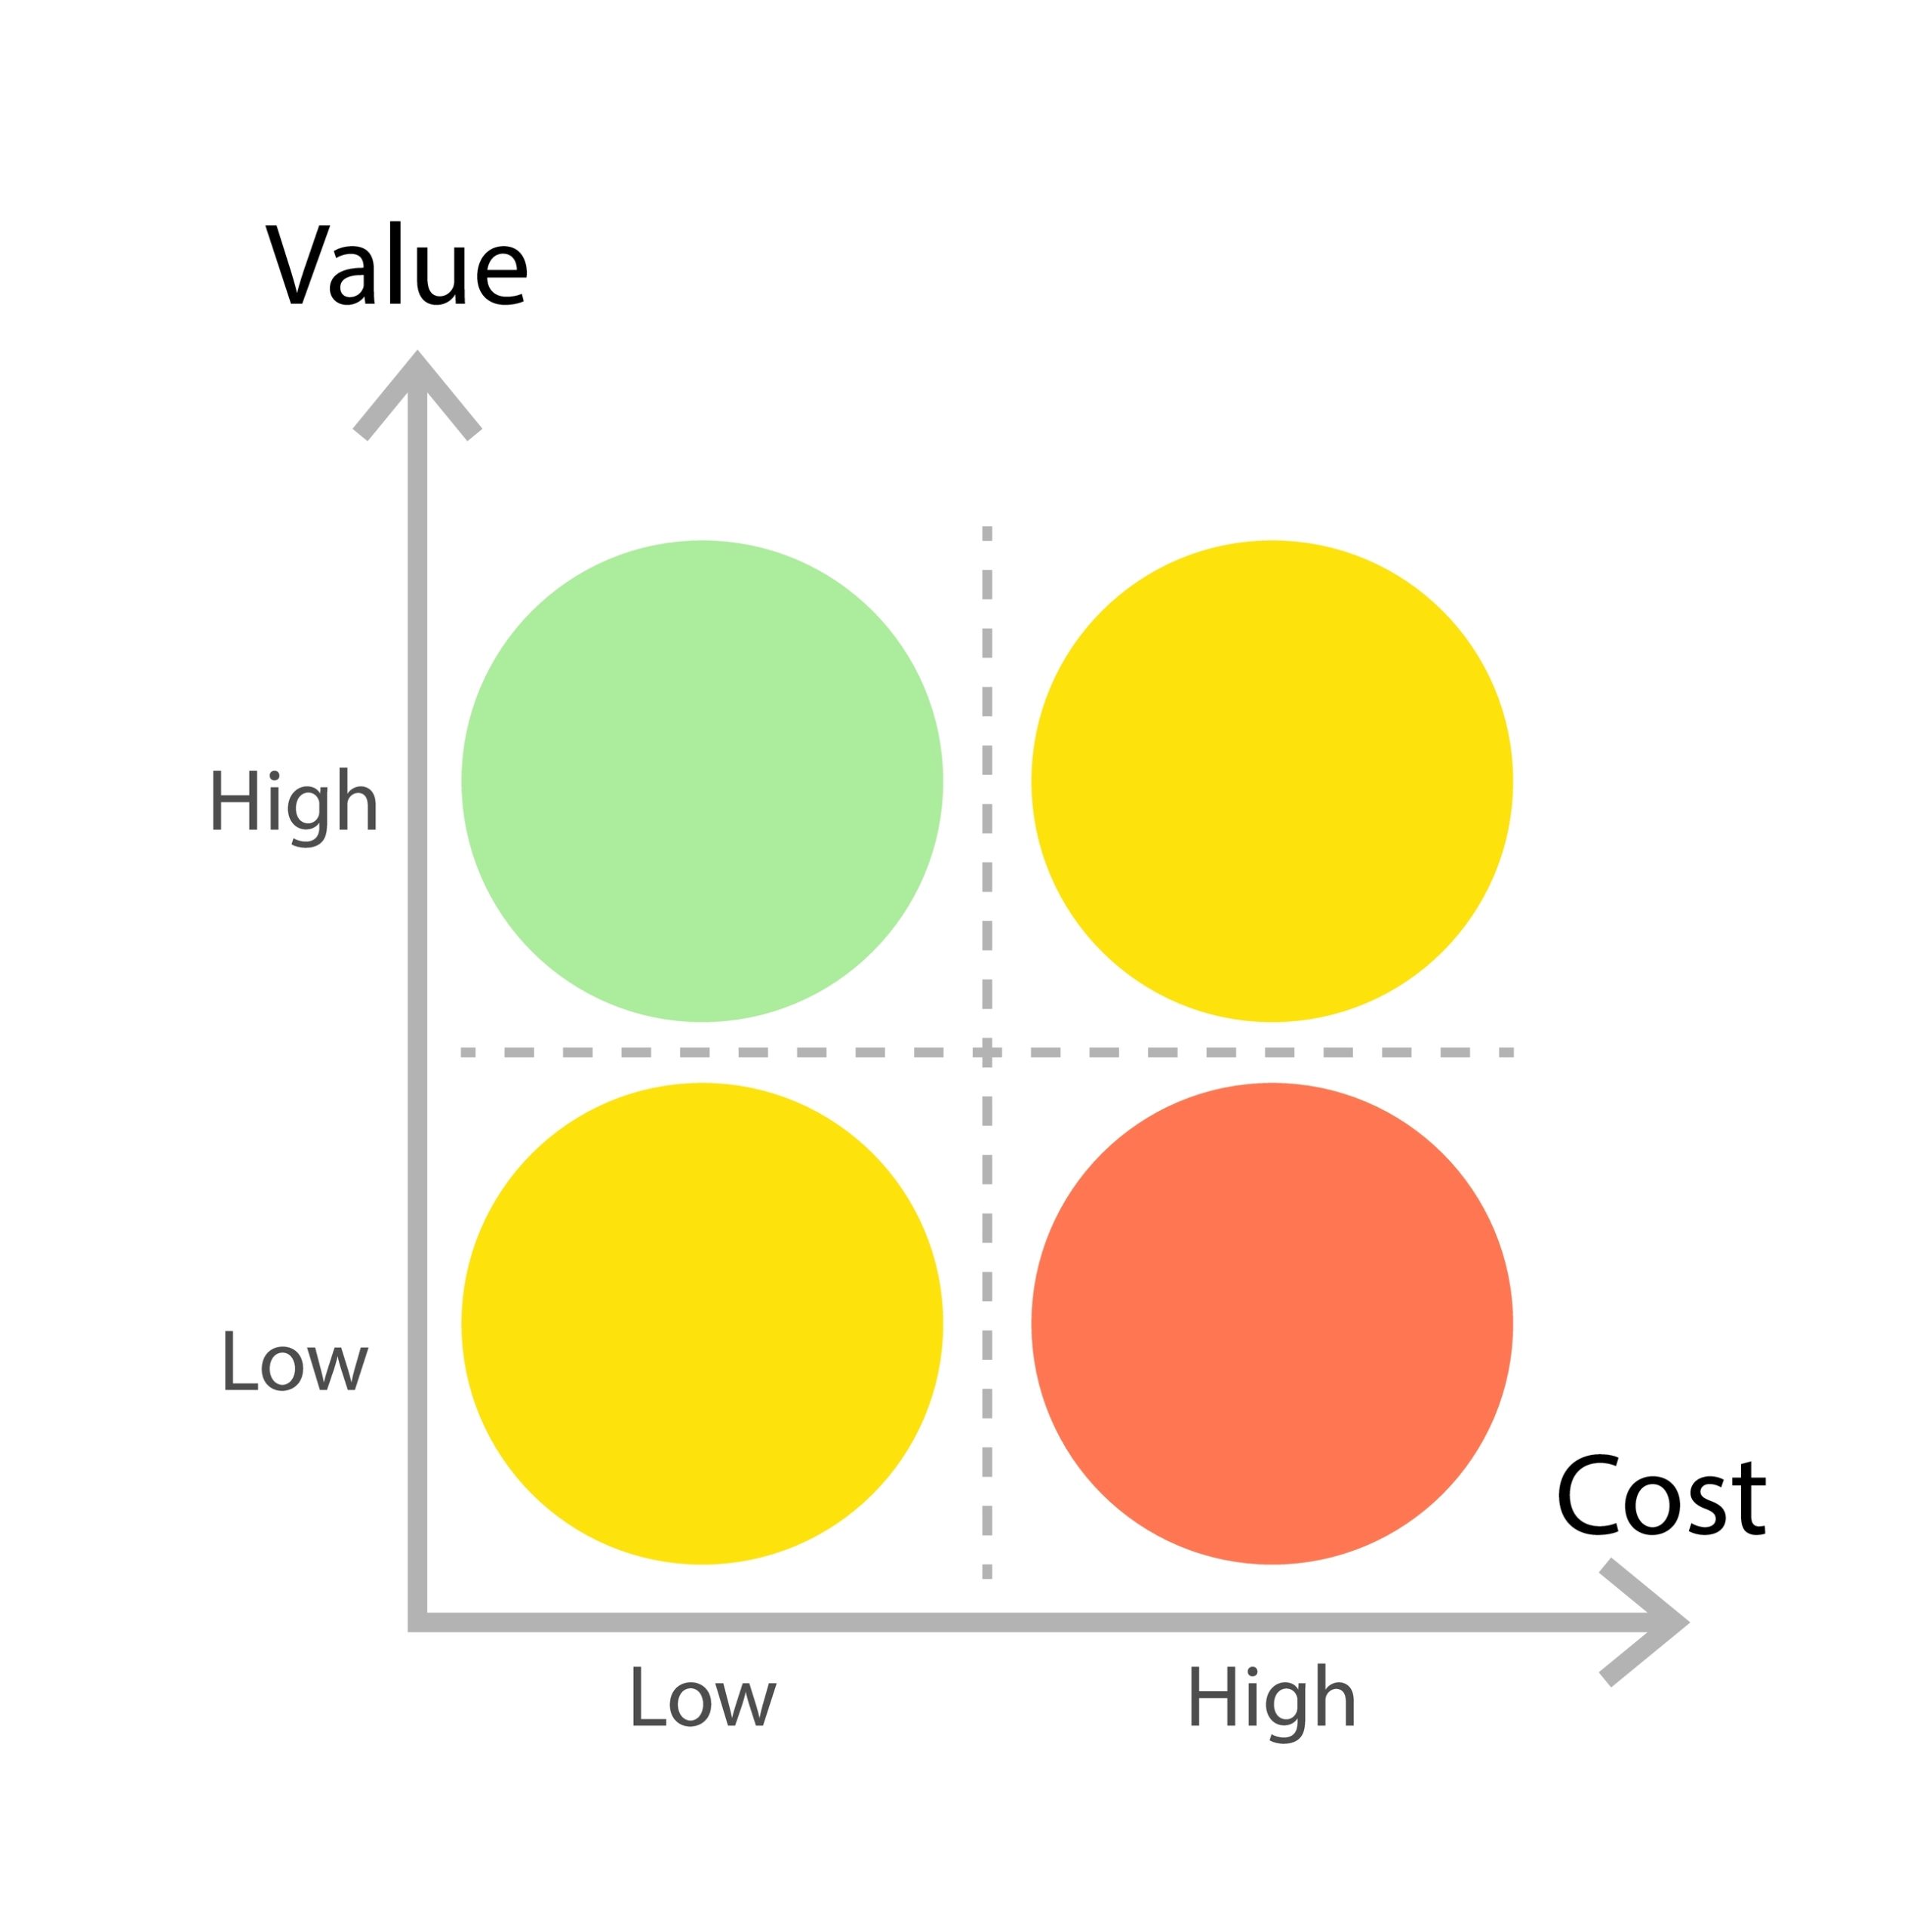
There is obviously a cost for a developer or business analyst to port the report to Power BI or Tableau or your platform of choice. You would need to consider the business value and the costs for having the report automated. One simple tool is a cost vs. value matrix like this below. The green area with high value and low cost (upper left section) is the best place to start.
2. How fresh does the data need to be?
Another key factor when considering modernizing your Excel reports is how fresh the data needs to be. If a report is only used annually, it may not be your top priority for automation. If your sales team or executives want a daily or hourly pulse of key business metrics, you should definitely consider automation. Services like Power BI and Tableau will automatically refresh the data sets on a schedule you choose. You can even push them to your users on a schedule or based on various triggers.

Power BI option to subscribe to a report
3. Are there multiple teams manipulating the same Excel report?
Is the Excel report currently being used by multiple departments that use it for different purposes? For example, is the same company sales data being used by sales, marketing, and executive leadership? Does each audience need to manipulate the report to see the data in a useful way? If so, automating to Power BI or Tableau is a great option. This will allow you to set up custom dashboards and views of the data where each audience can see exactly what they need.

4. How complex are the data sets?
If your Excel reports have lots of tabs, formulas, and rows of data, it is only a matter of time before it will no longer function on a typical business computer. I have seen many times where users will have huge volumes of data to end up with very simple and concise summaries or pivot tables. This is where platforms like Tableau and Power BI thrive. Both of these platforms can optimize the data extracts for quick performance in retrieving and summarizing data.
5. What are the risks of manually producing the reports?
If there is only a single person in your company that knows how to produce a critical Excel report, you are taking on a certain level of risk. “What if that person gets hit by a bus?” is still thrown around today and is effective at illustrating this point. At the very least, the person should document how they produce the report to mitigate this risk.
Having the report built in Tableau or Power BI also reduces this risk. Anyone with the skillset to operate those platforms can open up the project and trace how the data is pulled together. There will be no hidden steps or “I forgot to mention this part” if the report is properly set up.
Another risk consideration is inaccuracies appearing in your reports by having a person manually assemble the reports in Excel. If the reports require many steps to create them, there is always a chance of a mistake being made and your reports containing invalid data. With an automated report, that will no longer be a concern.
Need a Reporting Expert?
Are you tired of losing valuable time preparing reports in Excel? Do you find mistakes in the numbers? Contact us today to schedule a consultation. We can evaluate your needs and help you determine the best reporting platform for your business.