
Examined From the Perspective of a Football Team
The four stages of business intelligence was documented in the landmark book Competing on Analytics: The New Science of Winning, released in 2007. This laid the foundation for understanding and utilizing business intelligence (BI) in modern enterprises. The four stages of a company’s analytics journey outlined in this book (descriptive, diagnostic, predictive, and prescriptive) are still relevant today. I talked with Ryan Buckingham about this same topic in a recent LinkedIn Live interview.
Every company is at a different point on their journey to fully leverage these stages, depending on many factors.
Much like in high school math, where mastering the basics is crucial before advancing to more complex topics, each stage of BI analysis builds on the previous one. It can be tempting to try to jump ahead and skip some of the stages, especially with the buzz and rapid changes that AI. However, it is not recommended to skip ahead, as each stage builds essential understanding and unlocks more business value. Sticking to this structured approach ensures companies maximize their data insights.
What Does This Have to Do With Football?
I will illustrate each of these Business Intelligence stages by using the analogy of a football team. This ensures no one falls asleep and it coincides perfectly with the onset of fall and the start of high school, NFL, and college football seasons in the United States. Let’s get started!
1. Descriptive Analysis : What Happened?
Descriptive analysis is the foundational stage of BI and focuses on understanding what has happened in the past. By processing historical data, descriptive analysis provides a clear picture of past performance and trends.
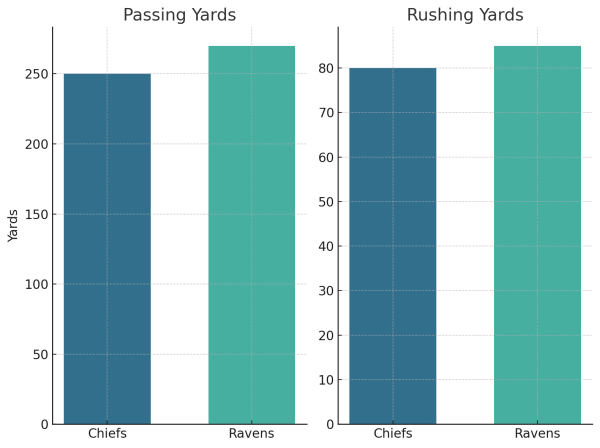
After a game, the coaches and players all review the game stats to get a picture of what happened.
- How many rushing and passing yards did we have?
- What was our conversation rate on 3rd down?
- How many turnovers did the defense force?
- Which player had the most tackles?
- How many sacks did the defense have?
2. Diagnostic Analysis: Why Did it Happen?
Building on the foundation of descriptive analysis, diagnostic analysis delves deeper into the data to uncover the underlying causes of observed trends and patterns. Out of the four stages of business intelligence, this stage involves drilling down into the data to answer the question, “Why did this happen?” Diagnostic analysis often requires more sophisticated analysis such as root cause analysis, and correlation analysis.
In the first stage of descriptive analysis, our coaches determined the team’s 3rd down conversion percentage was only 25%. But by digging further they found some driving forces behind this number. What caused this to happen?
Example Patterns Found on 3rd down conversions
- Average yards to go was 7 yards on failed attempts compared to 2 yards for the successful conversions
- The defense was lined up in a zone compared to man coverage for failed attempts
- All the failed attempts were running plays compared to passing plays for successful conversions
- The all-star offensive line right tackle was not on the field for all failed attempts

3. Predictive Analysis: What’s Likely to Happen?
Predictive analysis leverages historical data and statistical algorithms to forecast future outcomes. This stage is focused on answering the question, “What is likely to happen?” By using techniques such as regression analysis, time series analysis, and machine learning, predictive analysis provides actionable insights into future trends and potential scenarios.
In following with our 3rd down conversion example, the coaches could use data to help improve their chances of success in converting a 3rd down in their next game. Predictive analysis can help answer that question: “What’s likely to happen on 3rd down under certain circumstances?”
Example 3rd Down Predictions
- With less than 5 yards to go, running the ball has been more successful than passing – 65% success rate
- if defense is lined up in zone coverage, passing play is more effective based on past data
- The opponents’ defense is more likely to blitz when QB is in shotgun formation
- The opponent’s defense gives up 3 more yards than average when the passing target is the tight end position.
4. Prescriptive Analysis: What Should We Do?
The most advanced stage of BI analysis, prescriptive analysis, goes beyond predicting future outcomes to recommending specific actions that can optimize results. This stage answers the question, “What should we do?” Another way to look at this is through the lens of modern generative AI. In the past, when you asked a search engine, “Which oil filter fits my Honda?”, it would present a lot of options with links for you to click through and decide on your own what is correct. Now, with services like ChatGPT, it presents you with a single answer based on its training and algorithms.
This same principle applies to the difference between predictive and prescriptive analytics. Predictive gives you information to decipher, whereas prescriptive tells you what action to take. For our football coaches, the prescriptive analysis would look like a simple decision tree like this example below. Think of it like those blackjack strategy cards that help you make optimal decisions at the casino.
Example 3rd Down Recommended Actions
| # of Yards | Defensive Formation | Recommendation |
| < 3 | Zone | Run – off tackle |
| Man-to-Man | Run – sweep to left | |
| 4-8 | Zone | Pass – TE |
| Man-to-Man | Pass – WR | |
| >9 | Zone | Pass – WR |
| Man-to-Man | Pass – HB or WR |

What Keeps Companies From Getting To the Final Stage?
You might assume that most companies would easily move through these four stages. Yet, this isn’t always what happens. Many businesses don’t make it beyond the diagnostic stage 2. What factors could hinder their progress? Here are some factors:
- Data silos – complications of data in multiple places and inability to see all data at once
- Lack of technology including data warehouse, pipelines to load data, data visualization tools
- Data quality issues in business data assets
- Lack of leadership to focus resources and set direction
- Insufficient skills within the organization
The importance of progressing through the four stages of analytics—from descriptive to prescriptive analysis—cannot be overstated. Many companies stop after the first 2 steps. Companies that successfully navigate these stages can better understand past performance, diagnose current issues, predict future trends, and prescribe optimal courses of action.
However, overcoming challenges such as insufficient skills, lack of leadership, data quality issues, and technology shortfalls is crucial. Investing in training, fostering strong leadership, ensuring data quality, and implementing robust technological infrastructure can enable companies to break through these barriers and fully leverage the benefits of advanced analytics.
Need Help With Your Analytics Game Plan?
Integrity Data Insights can guide your company through these critical four stages of business intelligence. We have helped many companies, both big and small, with their data and reporting challenges. Don’t take our word, listen to what our clients have said. Take the next step and schedule a consultation today to maximize your analytics potential.